
Peptide Purity Variance and Experimental Results
Table of Contents
- Why Peptide Purity Variance Matters for Experimental Results
- What Is Peptide Purity and How Is It Measured?
- Peptide HPLC Analysis: Reading the Chromatographic Profile
- Common Peptide Synthesis Impurities and Their Sources
- How Impurities Affect Dose-Response and Assay Interference
- Experimental Reproducibility in Peptide Research: Batch-to-Batch Variability
- Storage Conditions and Degradation Kinetics After Receipt
- Conclusion
- Frequently Asked Questions
Last Updated: September 16, 2026
Why Peptide Purity Variance Matters for Experimental Results
A Certificate of Analysis reporting 98% purity sounds reassuring until you run the same assay twice and get two different curves. That gap between the label and your data is where peptide purity variance and experimental results collide, the most under-diagnosed source of irreproducible data in peptide research. At FROPeptides, we test every batch with multi-stage HPLC and mass spectrometry because a two-point purity swing can move a dose-response curve enough to invalidate a conclusion.
What Is Peptide Purity and How Is It Measured?
Peptide purity is the percentage of the total peptide mass in a sample that matches your target sequence, expressed as a relative percentage from chromatographic analysis. It is measured primarily by reverse-phase high performance liquid chromatography, with liquid chromatography-mass spectrometry confirming molecular weight and sequence identity. A purity percentage of 95% means roughly one in twenty peptide molecules in the vial is something else: a truncated sequence, a deletion product, or a counterion adduct.
Peptide HPLC Analysis: Reading the Chromatographic Profile
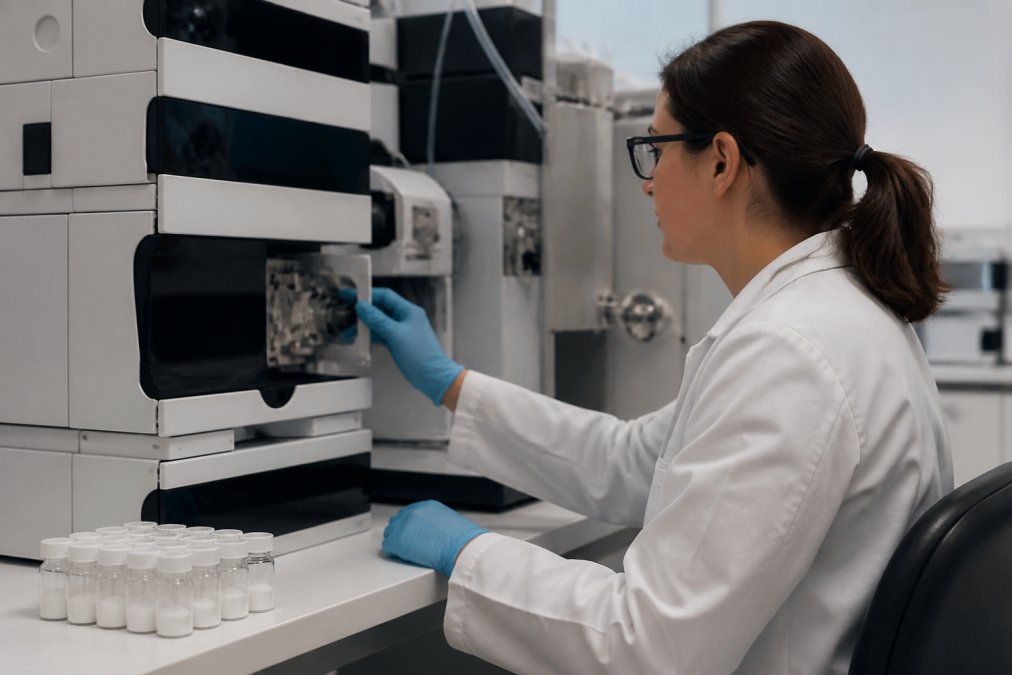
Peptide HPLC analysis separates components by hydrophobicity, and the chromatographic profile tells you more than the headline purity number. The main peak is your target peptide; every smaller peak is a synthesis byproduct, degradation fragment, or contaminant, and their relative areas produce the purity percentage.
Comparing purity percentages across suppliers without comparing chromatograms is a common mistake. A 98% batch from one source and a 98% batch from another are not interchangeable if their impurity profiles differ, and your assay will show it.
Interpreting Purity Percentage from HPLC Data
Read the purity percentage as a summary statistic, not a verdict. Check the main peak’s retention time against your expectation, confirm peak symmetry, and note whether the baseline is clean. Impurity quantification is only meaningful when the method is validated and integration is consistent. When in doubt, request the raw chromatogram alongside the certificate of analysis.
Common Peptide Synthesis Impurities and Their Sources
Solid-phase peptide synthesis generates predictable impurities, and knowing their origins helps you anticipate which batches will behave differently. Organize them by whether they are process-related (from reagents, solvents, resins, or handling) or product-related (structural variants of your target sequence). The two classes behave differently in assay and demand different corrective actions.
Process-Related Impurities
Process-related impurities come from everything that touches the peptide but is not the peptide itself.
| Impurity | Source | Typical Effect on Assay |
|---|---|---|
| Residual trifluoroacetic acid (TFA) | HPLC purification solvent | Shifts pH of reconstituted samples; can alter apparent potency |
| Residual organic solvents (acetonitrile, DMF, DCM) | Synthesis and purification | Cytotoxicity in cell-based assays at higher concentrations |
| Counterion adducts (acetate, chloride, TFA salts) | Salt-exchange step | Changes solubility and effective concentration |
| Endotoxin (lipopolysaccharide) | Insufficient purification or handling | Triggers inflammatory signaling in cell culture unrelated to the peptide |
| Residual metals (from resins or catalysts) | Coupling reagents and supports | Can inhibit or activate enzymes in biochemical assays |
| Water content | Lyophilization inefficiency | Alters accurate mass when weighing powder |
Product-Related Impurities
Product-related impurities share the peptide backbone but differ in structure. They are the ones most likely to confound dose-response work because they can retain partial biological activity.
| Impurity | Source | Typical Effect on Assay |
|---|---|---|
| Deletion peptides (one or more missing residues) | Incomplete coupling during synthesis | Reduced or altered receptor binding; flattens dose-response curves |
| Truncated sequences | Premature chain termination | Weak agonist or antagonist activity at high concentrations |
| Diastereomers (D-amino acid substitutions) | Racemization during coupling | Loss of target activity; can act as partial agonists |
| Oxidation products (Met, Cys, Trp) | Exposure to air, light, or peroxides | Reduced biological activity; altered receptor selectivity |
| Deamidation products (Asn, Gln) | pH and temperature during storage | Charge change alters binding and stability |
| Aggregates and oligomers | Concentration, freeze-thaw, hydrophobic sequences | Non-specific binding; assay interference |
Why the Distinction Matters
A process-related impurity usually shifts your readout through a non-specific mechanism: pH, tonicity, solvent toxicity, or immune activation. A product-related impurity can shift it through the same receptor you are studying, making it far harder to detect and more damaging to conclusions. If your dose-response curve flattens at the top or your EC50 drifts between lots, suspect product-related impurities first.
A certificate of analysis that reports only a single purity percentage hides which class of impurity is present. Two 98% batches, one with 2% TFA and one with 2% deletion peptides, will behave completely differently in assay.
Trifluoroacetic Acid Content and Counterion Effects
Trifluoroacetic acid content is a purification residue that matters more than most researchers assume. TFA binds basic residues and can shift the effective pH of your reconstituted sample, changing how the peptide behaves in a dose-response relationship. Acetate or hydrochloride salt forms let you control for this variable. Ask for TFA content on the certificate of analysis; if it is not listed, that signals the level of analytical testing behind the batch.
Reading Impurity Profiles on a Certificate of Analysis
A useful CoA reports the chromatographic profile in enough detail to show whether the impurity burden is one large shoulder or several small late-eluting peaks. A common pattern is a main peak at 98% with a single 1.5% shoulder eluting just before it, often a closely related deletion peptide and the one most likely to interfere with receptor binding.
When you evaluate a CoA, look for these fields:
- Purity percentage with the HPLC method and wavelength stated
- Retention time of the main peak
- Mass confirmation by LC-MS with observed vs. theoretical mass
- TFA or counterion content
- Water content and peptide content (net peptide vs. gross weight)
- Endotoxin result if the peptide is intended for cell culture
- Lot number and date of analysis
How Impurities Affect Dose-Response and Assay Interference
Impurities distort results through two mechanisms: they add biological activity of their own, or they interfere with detection. A truncated fragment may bind your target receptor weakly but still contribute signal at high concentrations, flattening the top of your dose-response curve. Endotoxin triggers inflammatory responses unrelated to your peptide, and residual solvents or counterions can shift your readout independent of any biological effect.
Run a vehicle control with the same counterion and buffer composition as your peptide samples. If your signal shifts, the effect may be coming from the formulation rather than the peptide itself.
Experimental Reproducibility in Peptide Research: Batch-to-Batch Variability
Experimental reproducibility in peptide research depends on controlling batch-to-batch variability, which starts with the supplier’s manufacturing consistency. Even well-run synthesis produces variation between lots; the question is whether it is characterized and disclosed, or hidden behind a single purity number.
Storage Conditions and Degradation Kinetics After Receipt
Degradation kinetics begin the moment a peptide leaves cold storage, and poor handling accelerates them. Lyophilized peptides are relatively stable, but once reconstituted, most sequences degrade measurably within days to weeks depending on buffer, pH, and temperature. Three variables you control: temperature, moisture exposure, and freeze-thaw cycling.
- Store lyophilized vials at the temperature specified on the certificate of analysis
- Aliquot reconstituted peptide before freezing to avoid repeated freeze-thaw cycles
- Use sterile technique and appropriate buffer to limit microbial contamination
- Record reconstitution date and monitor for changes in the chromatographic profile over time
An In-House Stability Protocol You Can Run Without an HPLC
Most labs lack a dedicated HPLC for incoming peptide QC, but you can still detect degradation before it ruins an experiment. The goal is not to reproduce the supplier’s method, it is to establish a baseline and watch for drift.
Step 1: Establish a baseline at receipt.
- Weigh the vial on an analytical balance and record the mass.
- Reconstitute a small aliquot in your actual assay buffer, not water, unless water is your assay buffer.
- Record the reconstitution volume, buffer composition, pH, and date.
- If you have a spectrophotometer, take a UV absorbance reading at 280 nm (for Trp/Tyr sequences) or 214 nm and record it.
Step 2: Run a functional baseline.
- Perform your standard assay with the fresh aliquot and record the full dose-response curve, not just the EC50.
- Save the raw data. This is your reference curve for every future comparison.
Step 3: Set up a stability time course.
- Aliquot the reconstituted peptide into single-use volumes.
- Store one aliquot at the recommended temperature, one at 4°C, and one at room temperature as a stress condition.
- Pull and assay an aliquot at 24 hours, 72 hours, 1 week, and 2 weeks.
Step 4: Watch for these degradation signatures.
- A rightward EC50 shift with unchanged maximum signal suggests partial activity loss, often from oxidation or deamidation.
- A drop in maximum signal with no EC50 shift suggests part of the peptide lost binding entirely.
- A leftward shift or increased baseline noise suggests an impurity or aggregate is contributing signal.
- Visible precipitate or changed clarity indicates aggregation or solubility loss.
Step 5: Document and compare across lots.
- Keep a simple log: lot number, reconstitution date, storage condition, assay date, and observed EC50.
- When a new lot arrives, run the same baseline assay and compare the curve shape, not just the number.
You do not need a full analytical suite to catch a bad lot. A reproducible functional assay run the same way every time will flag a degraded or impure batch before it contaminates a larger study.
Sequence-Specific Degradation Risks
Not all peptides degrade at the same rate. Certain residues are liabilities:
- Methionine oxidizes readily in air and light; store under inert gas if possible.
- Cysteine forms disulfide bonds and can dimerize or aggregate.
- Tryptophan oxidizes and is sensitive to light.
- Asparagine and glutamine deamidate, especially at neutral to basic pH.
- Aspartate-proline motifs are prone to acid-catalyzed cleavage.
When to Discard a Lot
Labs often keep using a peptide long after the data has started to drift. A practical rule: if the functional assay shows a greater than 20% change in EC50 or maximum signal versus the baseline curve, reproducible across two independent runs, retire the lot. A new vial costs far less than a retracted figure or failed experiment.
Stability is not a property you assume from a label, it is a property you verify in your own buffer, at your own temperature, with your own assay. Build the baseline, run the time course, and let the data tell you when a lot has expired.
Conclusion
Peptide purity variance is not a footnote in your methods section; it shapes every result downstream. Researchers who get reproducible data treat the certificate of analysis as a starting point, not a finish line, and demand batch-level traceability from their supplier. FROPeptides supports that standard with multi-stage HPLC testing, mass spectrometry verification, and a certificate of analysis for every batch, so you can defend your data with documentation behind it.
Frequently Asked Questions
What is a good purity level for peptides used in research?
For most research applications, 95% or higher purity is expected, while sensitive assays often require 98% or above. The certificate of analysis should state the purity percentage determined by HPLC. Lower purity grades may contain synthesis byproducts that interfere with dose-response measurements. Always match the purity grade to your assay sensitivity, and request batch-level documentation before committing to a supplier.
How do impurities in peptides affect experimental outcomes?
Impurities from peptide synthesis, such as truncated sequences or residual trifluoroacetic acid, can alter biological activity and introduce assay interference. Even a 2% variance in purity between batches may shift dose-response curves enough to complicate reproducibility. Researchers should review impurity profiles on the certificate of analysis and run pilot assays when switching suppliers or lots to confirm consistent performance.
Why does batch-to-batch purity variance occur in peptide synthesis?
Solid-phase peptide synthesis involves multiple coupling and deprotection steps where incomplete reactions generate byproducts. Variations in reagent quality, temperature, and purification efficiency between runs create measurable differences in the final chromatographic profile. Suppliers that perform multi-stage HPLC testing and mass spectrometry verification on every batch can document these differences, helping researchers assess whether a new lot meets their experimental requirements.
How can researchers verify peptide purity before starting experiments?
Request the certificate of analysis for each batch and review the HPLC chromatogram, mass spectrometry data, and stated purity percentage. Independently confirm molecular weight verification if your assay is sensitive. Store peptides under recommended conditions, typically lyophilized at -20°C, to prevent degradation kinetics from altering sample integrity. When possible, run a small pilot experiment to confirm the batch performs as expected before scaling up.