
Batch to Batch Consistency in Peptides: A 2026 Guide
Table of Contents
- Why Batch to Batch Consistency in Peptides Decides Your Data
- How to Interpret a Peptide Certificate of Analysis for Batch Consistency
- HPLC Peptide Testing Methods That Reveal Batch Variance
- Mass Spectrometry and Purity Profiles: Verifying Molecular Identity
- Peptide Reconstitution Issues That Mimic Batch Inconsistency
- Storage, Handling, and Visual Clues of Batch Degradation
- Conclusion
- Frequently Asked Questions
Last Updated: September 10, 2026
Why Batch to Batch Consistency in Peptides Decides Your Data
Batch to batch consistency in peptides is the degree to which separate manufacturing lots of the same peptide sequence deliver identical purity, mass, and biological behavior. When it slips, your assay results shift for reasons unrelated to your hypothesis.
This is the quiet failure mode in peptide research: a clean receptor binding curve suddenly drifts, and the first suspect is the protocol, not the vial. At FROPeptides, we test every lot with multi-stage HPLC and mass spectrometry because the vial is the variable researchers forget to check.
Below, we’ll show you how to read a certificate of analysis, spot degradation before it ruins a run, and separate real batch variance from handling errors.
How to Interpret a Peptide Certificate of Analysis for Batch Consistency
A peptide certificate of analysis (COA) is the manufacturer’s documented record of analytical testing for a specific lot, and the single most useful document for judging batch consistency. Read it before you reconstitute anything.
Four fields decide whether a COA is trustworthy:
- Lot number and date of analysis. No lot number means no traceability. Walk away.
- Chromatographic purity percentage, measured by HPLC. This is your headline number.
- Molecular weight confirmation by mass spectrometry, matched against the theoretical mass of the peptide sequence.
- Method details. A purity figure without the column, gradient, and wavelength used to generate it is a claim, not data.
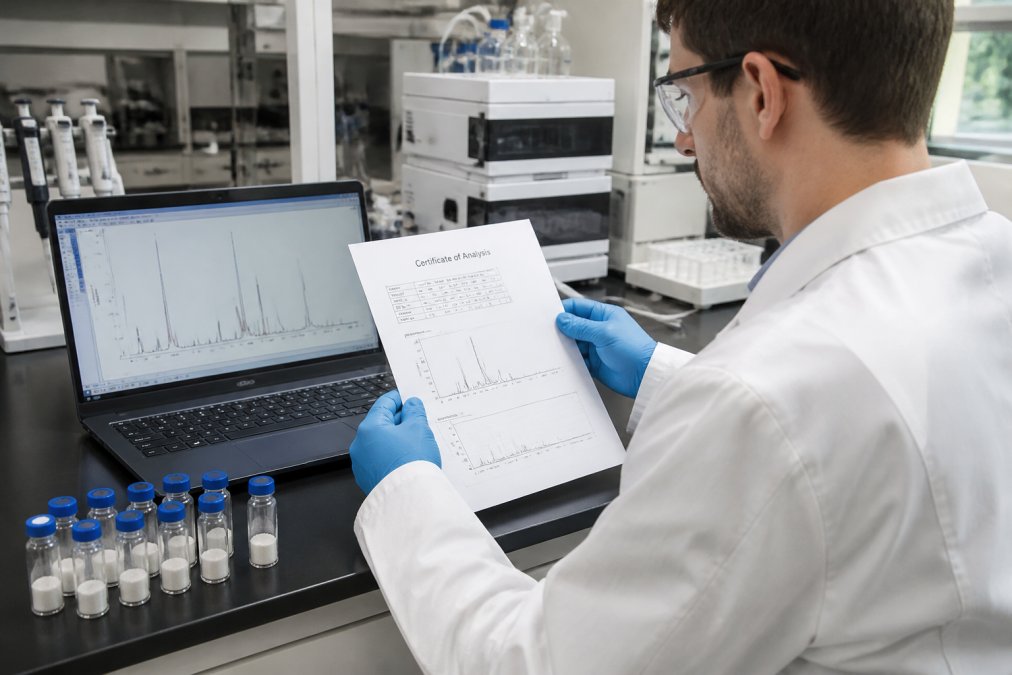
Two vendors can report “98% pure” from methods with very different resolving power. Ask for the chromatogram itself, not just the summary line.
Compare the retention time and peak shape across consecutive lots, not just the purity percentage. A lot that reports 98% but shows a new shoulder peak is a different product in practice, even if the headline number matches.
HPLC Peptide Testing Methods That Reveal Batch Variance
Reversed-phase HPLC is the workhorse for peptide purity testing, separating components by hydrophobicity so impurities elute as distinct peaks (PubMed). The method matters as much as the result.
A well-designed HPLC peptide testing protocol specifies the column chemistry, mobile phase gradient, flow rate, detection wavelength, and injection volume (usp.org). Change any one and the same sample can read several percentage points apart, which is why comparing purity numbers across suppliers using different methods is close to meaningless.
What most guides miss is that HPLC alone cannot confirm identity: it tells you how many things are in the vial, not that the main peak is the peptide you ordered.
| What You Want to Know | Test That Answers It | What a Bad Result Looks Like |
|---|---|---|
| How much impurity is present | HPLC chromatographic purity | Extra peaks or shoulders |
| Is it the right molecule | Mass spectrometry | Mass off by more than rounding |
| Is it degrading over time | Stability testing at intervals | Purity drop across lots |
| Is the method trustworthy | Analytical validation data | Missing method parameters |
A User-Level Verification Protocol Most Guides Skip
You do not need a full analytical lab to catch a bad lot before it reaches your assay, just a repeatable, documented sequence that turns a vague suspicion of “bad batch” into evidence. The protocol below is what most contract labs would run on a suspect lot, scaled down to a research bench.
Step 1, Establish a reference lot. Pick one lot you have already validated in your own assay and treat it as your internal standard. Every future lot gets compared against it, not against the COA number. A supplier’s 98% and your 98% are only comparable if the method is identical.
Step 2, Run a side-by-side HPLC injection. Reconstitute the reference lot and the new lot at the same nominal concentration in the same solvent, and inject them back to back on the same instrument with the same method. Do not compare a fresh chromatogram against a stored one from last quarter; column age and mobile phase prep drift between runs. Look for three things:
- Retention time shift. A main peak that moves by more than a fraction of a minute between lots suggests a different impurity profile or a different salt form.
- New shoulder or leading peaks. A shoulder that was absent in the reference lot is the clearest single sign of a real batch difference.
- Peak symmetry. Tailing that appears in one lot but not the other often points to a deprotection or cleavage byproduct.
Step 3, Confirm identity by mass. HPLC tells you how many things are in the vial, not what they are. A mass spectrometry check on the new lot, matched against the theoretical mass of your sequence, is the only way to rule out a truncated or mis-synthesized peptide that co-elutes with the target peak.
Step 4, Quantify, do not eyeball. Peak area percentage is the number you compare, not the visual height of the peak. A lot that looks “about the same” on screen can differ by several percentage points in integrated area.
Step 5, Log the result against the reference. Keep a running table of lot number, retention time, main-peak area percent, and mass confirmation. After three or four lots you will have a variance baseline, and any lot outside it is flagged before it enters an assay.
If you cannot run HPLC in-house, ask the supplier for the raw chromatogram file, not just the summary purity line. Most will provide it on request, and overlaying two lots’ chromatograms in free viewer software is a five-minute check that catches most real batch differences.
What Acceptable Variance Actually Looks Like
There is no universal pass/fail number, but main-peak purity between consecutive lots of the same sequence should typically fall within a point or two of the supplier’s stated specification, not five. If your reference lot integrated at 98.2% and the new lot integrates at 94.1% under the identical method, that is not analytical noise; that is a different product in practice.
Retention time is the more sensitive indicator. A shift of more than a few tenths of a minute on the same column and method usually means the impurity profile changed, even when the headline purity number looks acceptable. Treat retention time as your early-warning signal and purity percentage as your confirmation.
For a deeper look at how purity is defined and measured across the industry, the United States Pharmacopeia standards for analytical testing publishes reference methods that many labs adopt.
Mass Spectrometry and Purity Profiles: Verifying Molecular Identity
Mass spectrometry confirms molecular identity by measuring the mass-to-charge ratio of the peptide and matching it to the theoretical mass calculated from the sequence. HPLC tells you how clean the sample is; mass spectrometry tells you what it is.
For a peptide with a known sequence, the expected mass follows from the amino acid composition, including any N- or C-terminal modifications. A match within the instrument’s tolerance confirms the molecular structure; a mismatch, even with high HPLC purity, means you are holding the wrong compound.
This is where batch effect really bites: two lots can both pass HPLC at high purity and still differ if one carries a truncated sequence or incomplete deprotection product that co-elutes with the target peak. Purity profile and identity verification are separate questions, and you need both answers.
Never accept a COA that reports purity without a mass spectrometry confirmation. A high HPLC number with no mass data leaves identity unverified, and an unidentified impurity can silently alter your assay results.
Batch Effect Correction in Data Analysis
Even a perfectly consistent peptide can produce inconsistent data if you run it across multiple plates, days, or instruments. Batch effect is the technical variation introduced by those groupings, and the reason two labs using the same peptide can report different results. Correcting for it is a data-analysis problem, not a manufacturing one, and the step most researchers skip until a reviewer asks.
The practical approach is to treat each experimental run as a batch and design for it before you collect data:
- Include a shared control on every plate. A single reference peptide or standard well run on each plate lets you measure how much each batch drifted and normalize against it. Without a bridging control, batch effects are invisible until they corrupt a comparison.
- Randomize sample placement. Do not run all of one lot on plate one and all of the other on plate two. Interleave them so any plate-level drift affects both lots equally.
- Run lots in the same session when the comparison matters. If you must split across days, repeat the reference lot on both days so you have a common anchor.
- Normalize to the control, not to the raw signal. Express each measurement as a ratio or percentage of the plate’s control value before comparing across batches.
A common pattern in peptide assays is that apparent “batch inconsistency” disappears once data are normalized to a per-plate control. If the difference vanishes after correction, the variance was in your run, not the vial.
Defining Acceptable Variance Thresholds
There is no single regulatory number for acceptable lot-to-lot variance, but you can set defensible internal thresholds:
- Purity: consecutive lots should fall within a narrow band around the supplier’s specification, a point or two, not five. A drop larger than that under an identical method is a real difference.
- Mass: must match theoretical mass within the instrument’s stated tolerance. Any deviation beyond rounding is a fail, regardless of HPLC purity.
- Concentration: measured concentration should fall within the tolerance your assay can absorb. For most binding and activity assays, a few percent is tolerable; for quantitative standards, tighter.
- Retention time: the most sensitive early-warning metric. A shift of more than a few tenths of a minute on the same column and method signals a changed impurity profile even when purity looks fine.
Set these thresholds before you receive the next lot, write them into your lab’s standard operating procedure, and document every lot against them. A threshold defined in advance is evidence; one invented after seeing a bad result is not.
Identity verification and batch effect correction answer two different questions: mass spectrometry tells you whether the vial contains the right molecule, and proper experimental design tells you whether your data reflect the molecule or your run. You need both before you can trust a comparison across lots.
Peptide Reconstitution Issues That Mimic Batch Inconsistency
Peptide reconstitution issues cause more false “bad batch” reports than actual manufacturing variance. Before blaming the supplier, rule out how the vial was handled.
Common culprits:
- Wrong solvent. Hydrophilic peptides dissolve readily in water; hydrophobic sequences often need a small amount of acetonitrile or DMSO first.
- Aggregation. Adding solvent too fast, or vortexing aggressively, can drive peptides into aggregates that never fully dissolve.
- Concentration errors. Assuming complete dissolution when a faint haze remains skews your molarity.
- pH drift. Some peptides are far more soluble at a specific pH, and unbuffered water may not get you there.
A practical check: reconstitute a small aliquot, inspect it against a light source, and confirm clarity before scaling up. If one lot dissolves cleanly and another clouds under identical conditions, that difference is real and worth documenting.
Storage, Handling, and Visual Clues of Batch Degradation
Storage and handling decide whether a good batch stays good. Lyophilized peptides are relatively stable when kept cold, dry, and sealed, but the margin narrows fast once moisture or heat enters.
Visual identification of batch degradation is imperfect but useful. Watch for a color shift from white to yellow or brown, clumping instead of free-flowing powder, or a vial that no longer goes fully into solution. None alone proves degradation, but any justifies a fresh analytical check before committing the material to an assay.
Cold chain is where suppliers cut corners. A shipment that sits on a warm tarmac for hours can arrive looking fine and still carry measurable degradation. Ask how temperature is controlled from dispatch to delivery, not just at the warehouse.
Batch consistency is a chain, not a single test. Manufacturing, analytical verification, shipping, and your own handling each add variance, and the weakest link sets your real-world reproducibility.
Conclusion
The hardest part of peptide research is not running the assay, it is trusting the material going into it. Batch consistency lives or dies on documented testing, honest traceability, and handling discipline from synthesis to bench.
FROPeptides builds that trust into every order with multi-stage HPLC testing, mass spectrometry verification for each batch, and Certificate of Analysis documentation you can check line by line. Temperature-controlled storage protects compound integrity before dispatch, and batch-level traceability means you always know what is in the vial.
Get started with FROPeptides and give your assays material you can actually verify.
Frequently Asked Questions
Why does batch-to-batch consistency matter in peptide research?
Even small purity variances between batches can shift biological activity, alter assay outcomes, and make results hard to reproduce. If one batch is 95% pure and the next is 98%, your dose-response curve may look different for reasons unrelated to your experiment. Consistent batches let you attribute changes to your variables, not your material. Researchers should treat batch consistency as a core experimental control, not an afterthought.
How can researchers verify the consistency of their peptide batches?
Start with the Certificate of Analysis: compare HPLC chromatograms, mass spectrometry data, and purity percentages across batches. Look for consistent retention times and molecular weights. Run your own analytical testing if possible, such as HPLC or mass spec, on incoming vials. Track lot numbers and storage conditions. If you see shifts in solubility, color, or assay performance, cross-reference those with the COA data to identify whether the issue is the batch or your handling.
What are the common indicators of poor peptide batch consistency?
Watch for visible clumping or discoloration in lyophilized powder, incomplete reconstitution, unexpected precipitation, and shifts in HPLC retention time or peak shape. In assays, inconsistent potency or unexpected immune responses can signal batch problems. Also check for missing or incomplete COA documentation. If a supplier cannot provide batch-specific analytical data, that is a red flag. Consistent suppliers document every lot with traceable analytical results.
How should researchers interpret a Certificate of Analysis for batch consistency?
Focus on three things: purity percentage by HPLC, molecular weight confirmation by mass spectrometry, and the specific analytical method used. A COA that lists only a purity number without chromatograms or spectra offers limited verification. Compare the current batch COA to previous batches from the same supplier. Look for consistent peak profiles and impurity levels. If the COA shows a new impurity peak or a shift in retention time, ask the supplier for an explanation before using the material.