Research Grade Peptide Purity Standards: A 2026 Guide
Table of Contents
- What Defines Research Grade Peptide Purity?
- HPLC Purity vs. Peptide Content: Why the Distinction Matters
- Understanding Peptide HPLC Analysis Interpretation
- Peptide Purity Testing Services vs In-House Verification
- The Impact of Sequence Length and Synthesis on Purity
- COA Documentation for Research Peptides: What to Demand
- Common Impurities and Batch-to-Batch Consistency Metrics
- Conclusion: Setting Your Quality Threshold for Research
- Frequently Asked Questions
Last Updated: September 8, 2026
What Defines Research Grade Peptide Purity?
Research grade peptide purity standards refer to the verified analytical benchmarks that confirm a peptide’s identity, structural integrity, and freedom from synthesis-related contaminants suitable for laboratory investigation. At FROPeptides, we interpret this as a dual requirement: chromatographic purity measured by HPLC and identity confirmation through mass spectrometry, both documented per batch. Purity claims are meaningless without specifying the analytical method used to generate them.
A peptide that is 98% pure by HPLC can still contain residual solvents, counter-ions, or truncated sequences that interfere with sensitive assays, producing false signals or skewed kinetic data. Researchers must evaluate purity claims against their specific application requirements rather than accepting a single number at face value.
Treating purity percentage as the sole purchasing criterion is a common mistake. The analytical sensitivity of your downstream application determines whether a 95% pure peptide is sufficient or whether you require 99% or higher.
A purity percentage without accompanying HPLC chromatograms and mass spectrometry data is an assertion, not a verification. Always demand the analytical evidence before committing to a supplier.
HPLC Purity vs. Peptide Content: Why the Distinction Matters
Chromatographic purity and actual peptide content answer fundamentally different questions. HPLC purity measures the proportion of UV-absorbing material that elutes as the target peak, while peptide content accounts for the mass fraction of the lyophilized powder that is actual peptide versus water, salts, and counter-ions. A vial can display 98% HPLC purity yet contain only 80% peptide by weight.
Understanding Chromatographic Peak Area
The chromatographic peak area reported on your Certificate of Analysis reflects the relative abundance of the target peptide compared to all detectable impurities. This calculation assumes equivalent UV absorbance across all species, which is rarely accurate. Truncated sequences missing aromatic residues absorb less strongly at 214 nm, leading to underestimation of their true abundance in the impurity profile.
The Role of Counter-ions and TFA Content
Most synthetic peptides are purified via reversed-phase HPLC using trifluoroacetic acid (TFA) in the mobile phase, resulting in a TFA salt form of the final product. TFA content can constitute a substantial portion of the gross weight, sometimes reaching 10-30% depending on the number of basic residues (peer-reviewed research). This matters for accurate reconstitution and dosing, since the peptide content rather than the gross weight determines your final molar concentration.
| Purity Metric | What It Measures | Why It Matters |
|---|---|---|
| HPLC Purity | Proportion of target peak area | Confirms absence of detectable impurities |
| Peptide Content | Actual peptide mass fraction | Determines accurate molar concentration |
| TFA Content | Counter-ion percentage | Affects reconstitution calculations |
| Molecular Weight | Sequence verification | Confirms correct product identity |
Understanding Peptide HPLC Analysis Interpretation
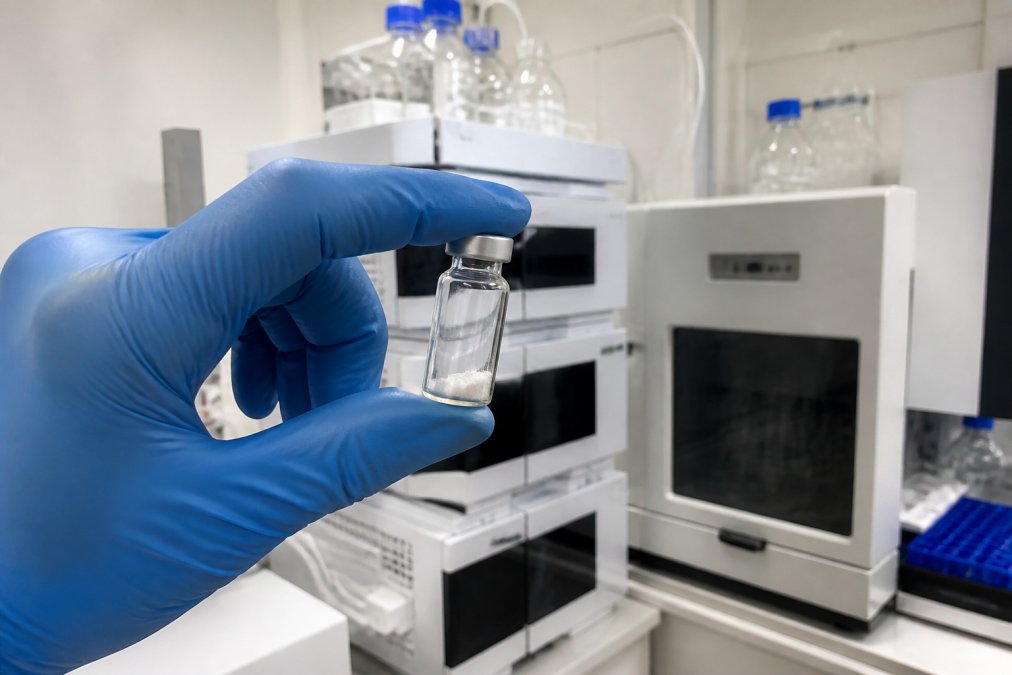
Interpreting an HPLC trace requires more than locating the dominant peak. The analytical sensitivity of the method, detection wavelength, and gradient conditions all influence the report. A qualified analyst examines the baseline for unresolved shoulders, evaluates impurity peaks, and considers whether the reported purity reflects the actual composition of the vial.
Key Signals to Check on Your HPLC Report
When reviewing an HPLC report, the retention time should match the expected value for your peptide sequence, and the peak shape should be symmetrical without fronting or tailing that suggests co-eluting contaminants. The impurity profile matters as much as the main peak percentage, since the nature of impurities reveals whether they arise from incomplete synthesis or degradation during storage.
- Peak symmetry: Asymmetrical peaks indicate co-elution or column overload
- Impurity count: Fewer discrete impurity peaks suggests cleaner synthesis
- Baseline stability: Rising baselines may indicate gradient artifacts or column contamination
- Detection wavelength: 214 nm detects peptide bonds; 280 nm detects aromatic residues only
Independent Verification Protocol: A Step-by-Step Approach
When you suspect the Certificate of Analysis (CoA) may not reflect the vial’s contents, here is a practical protocol for verifying a supplier’s claims in a standard analytical lab.
Step 1: Reproduce the Supplier’s Method. Request the full HPLC method parameters, column type (e.g., C18, 5 µm, 4.6 x 250 mm), mobile phase composition (e.g., 0.1% TFA in water/acetonitrile), gradient slope (%B per minute), flow rate, and column temperature. Run your sample under these exact conditions. If your observed retention time differs by more than 0.2 minutes from the CoA, it suggests either a different peptide or a method mismatch.
Step 2: Perform a Purity Spike. Prepare a solution of your peptide and a known impurity standard (e.g., a truncated sequence or a common oxidation product like methionine sulfoxide). Inject the peptide alone, then inject a 1:1 mixture. If the impurity peak in the mixture does not co-elute with a peak in your peptide’s chromatogram, the reported purity is likely accurate for that specific impurity. If it does co-elute, the supplier’s purity may be overestimated.
Step 3: Quantify Peptide Content Independently. HPLC purity does not measure the actual peptide mass. Use a UV spectrophotometric method: dissolve a precisely weighed amount of lyophilized powder in a known volume of buffer, measure absorbance at 280 nm, and calculate the concentration using the peptide’s molar extinction coefficient (based on tryptophan and tyrosine content). Compare this to the supplier’s peptide content claim. A discrepancy greater than 5% warrants a query to the supplier.
Step 4: Check for TFA Counter-ion by NMR. If your peptide has multiple basic residues (arginine, lysine, histidine), TFA content can be significant. A simple 19F NMR experiment can quantify TFA against an internal standard (e.g., sodium trifluoroacetate). This step is rarely performed by researchers but is critical for accurate molar dosing.
If your independent verification reveals a purity or content discrepancy greater than 5% from the CoA, do not use the batch for quantitative assays. Contact the supplier with your data and request a replacement or a detailed explanation. Reputable suppliers will investigate and often re-analyze retained samples from the same batch.
Peptide Purity Testing Services vs In-House Verification
Peptide purity testing services vs in-house verification presents a trade-off between specialized analytical expertise and laboratory convenience. Contract laboratories offer advanced instrumentation but introduce shipping risks and delays. In-house verification provides immediate results but requires method development expertise and instrument time.
For most research groups, a hybrid approach works best: rely on the supplier’s documented quality control as the primary gate, then perform targeted in-house verification for critical batches. The cost of in-house verification is modest compared to the expense of compromised experiments.
Request the full analytical method parameters from your supplier, including gradient conditions and detection wavelength. Reproducing these conditions in-house allows direct comparison of your verification runs against the manufacturer’s certificate.
The Impact of Sequence Length and Synthesis on Purity
Sequence length fundamentally constrains the achievable purity of synthetic peptides. Longer sequences require more coupling steps, each carrying a finite failure rate that produces truncated sequences. A 30-mer peptide will invariably contain a more complex impurity profile than a 10-mer synthesized under identical conditions.
This reality shapes realistic expectations for research grade peptide purity standards. While short peptides routinely achieve 99% or higher HPLC purity, longer sequences may plateau at 95-97%. Researchers designing experiments with extended sequences should consider whether the specific impurities present could interfere with their assay system.
Purification by preparative HPLC necessarily sacrifices yield to achieve higher purity. Suppliers who prioritize maximizing yield may ship material with marginal purity, while those committed to quality accept lower recovery to deliver cleaner product.
COA Documentation for Research Peptides: What to Demand
A Certificate of Analysis (CoA) serves as the contractual evidence that a peptide batch meets its stated specifications. COA documentation for research peptides should include the peptide sequence, molecular weight confirmation via mass spectrometry, HPLC purity with the chromatogram, and the analytical methods used, along with the batch number, date of analysis, and analyst’s identification.
Mass Spectrometry and Molecular Weight Confirmation
Mass spectrometry provides orthogonal confirmation that the synthesized product matches the intended sequence. The observed molecular weight should match the theoretical value within instrument tolerance, typically within 0.5-1.0 Da for modern instruments (PubMed). Discrepancies beyond this range indicate sequence errors, incomplete deprotection, or unexpected modifications that render the material unsuitable for research.
Quality assurance protocols should require both analytical methods because they detect different failure modes. HPLC reveals purity but cannot confirm identity, while mass spectrometry confirms identity but provides limited purity information. Together, they offer complementary evidence that the peptide is both the correct molecule and sufficiently clean for experimental use.
Common Impurities and Batch-to-Batch Consistency Metrics
Common impurities in synthetic peptides include truncated sequences from incomplete coupling, deletion sequences from missing residues, and oxidation products, particularly at methionine and cysteine residues. Racemization during synthesis can also produce diastereomers that may co-elute with the target peak under standard conditions. Understanding these impurity profiles helps researchers anticipate potential interference in their specific applications.
The Composition of the ‘Other’ Percentage
A purity claim of 95% by HPLC means 5% of the UV-absorbing material is something else. What is that 5%? It is rarely a single contaminant. A typical impurity profile for a 20-mer peptide synthesized via Fmoc solid-phase chemistry includes:
- Truncated sequences: These arise from incomplete coupling or deprotection steps. For a 20-mer, the most common truncations are (1-19), (1-18), and internal deletion sequences where a single residue was skipped. They are often the largest impurity class.
- Oxidation products: Methionine sulfoxide is the most frequent oxidation impurity, especially if the peptide was exposed to air during lyophilization. Cysteine can form disulfide-linked dimers or undergo beta-elimination.
- TFA salts and residual solvents: These are not detected by UV at 214 nm but can constitute 10-30% of the gross weight. Acetonitrile and water from the HPLC purification process can also remain trapped in the lyophilized cake.
- Diastereomers: Racemization at the alpha-carbon during coupling produces D-amino acid isomers. These are notoriously difficult to remove because they often co-elute with the target peak under standard reversed-phase conditions.
A Framework for Evaluating Batch-to-Batch Consistency
Batch-to-batch consistency is not about a single purity number but the reproducibility of the entire impurity profile. A supplier that consistently delivers 97% purity with the same three minor impurity peaks is more reliable than one that alternates between 99% and 95% with varying impurity patterns. Here is a practical framework for evaluation:
Metric 1: Purity Range Across Batches. Request CoAs from at least three independent batches of the same peptide. Calculate the range of reported HPLC purity. A range of less than 2% (e.g., 96.5% to 98.2%) indicates a stable process (the FDA). A range greater than 5% suggests poor process control.
Metric 2: Impurity Profile Similarity. Compare the HPLC chromatograms from different batches. Look for the same impurity peaks at similar relative retention times. The coefficient of variation (CV) for the area of the top three impurity peaks should be below 15%. If a new impurity peak appears in a later batch, it may indicate a change in raw material or synthesis conditions.
Metric 3: Peptide Content Reproducibility. The peptide content (mass fraction of actual peptide) should also be consistent. A variation of more than 3% between batches will affect your molar concentration calculations and can introduce systematic error into dose-response studies.
Metric 4: MS Spectrum Overlay. Overlay the mass spectrometry spectra from different batches. The target molecular ion should be present at the same relative intensity, and any adducts (e.g., sodium or TFA adducts) should appear consistently. A new adduct peak in a later batch may indicate a change in the salt form or counter-ion.
Why This Matters for Longitudinal Studies
For multi-month studies requiring multiple peptide orders, batch-to-batch inconsistency can confound results. A change in the impurity profile between batches could alter the effective concentration of the active peptide or introduce a new impurity that interferes with your assay. Establish a baseline with the first batch and compare all subsequent batches against it.
Do not accept a single CoA as proof of quality. Ask for historical batch data. A supplier that cannot provide consistent impurity profiles across multiple batches is not a reliable partner for rigorous, publication-ready research.
Conclusion: Setting Your Quality Threshold for Research
Establishing your laboratory’s quality threshold requires matching purity specifications to the analytical sensitivity of your downstream applications. In vivo studies and sensitive molecular assays demand the highest purity grades with complete analytical documentation, while preliminary screening may tolerate slightly lower purity material. Define your acceptance criteria before ordering and require batch-level CoA documentation.
FROPeptides supports rigorous research protocols by providing peptides verified through multi-stage HPLC testing and mass spectrometry for every batch, with Certificate of Analysis documentation and batch-level traceability from sourcing to packaging. Our temperature-controlled storage and handling ensures compound integrity from our facility to your laboratory, and our ready inventory eliminates the uncertainty of backorders. For researchers who require consistent, traceable materials for peer-reviewed publication, we offer the analytical transparency that quality science demands.
Get started with FROPeptides and secure research-grade peptides that meet your strictest purity benchmarks for reproducible, publication-ready results.
Frequently Asked Questions
What is a good purity level for peptides?
For most research applications, 95% purity is the minimum baseline for reliable data. However, for sensitive molecular analysis, enzyme assays, or in vivo studies, research grade peptide purity standards typically demand 98% or higher. At 99% purity, you minimize the risk of truncated sequences or side reactions interfering with your assay results. Always match the purity threshold to the sensitivity of your specific protocol, not just to a generic industry number.
Is 98% purity good for a peptide?
Yes, 98% purity is generally considered high quality and is suitable for most in vitro studies and cell culture work. The remaining 2% typically consists of truncated sequences, deletion peptides, or residual solvents. For highly sensitive assays where even minor impurities can skew results, 99% purity is safer. Review the Certificate of Analysis to confirm that the 98% figure refers to HPLC purity and not just peptide content, as these are different measurements.
How is peptide purity verified through HPLC and mass spectrometry?
HPLC (High-Performance Liquid Chromatography) separates the peptide from impurities, and purity is calculated by measuring the chromatographic peak area of the main compound versus all other peaks. Mass spectrometry (MS) confirms the molecular weight of the peptide, verifying that the correct sequence was synthesized and that no major truncation occurred. A Certificate of Analysis should include both the HPLC chromatogram and the MS spectrum for complete sequence verification.
What is the difference between HPLC purity and peptide content?
HPLC purity measures the proportion of your target peptide relative to other peptide-related impurities in the sample. Peptide content, however, measures the actual mass of peptide versus salt, water, and counter-ions like TFA. A peptide can be 99% pure by HPLC but only 80% peptide by weight. For accurate molar concentration in your experiments, you must account for both values. Always check the Certificate of Analysis for both metrics before calculating dosages.
What are the common impurities found in synthetic peptides?
The most common impurities are truncated sequences where the synthesis failed to add an amino acid, deletion peptides missing internal residues, and terminated sequences from incomplete coupling reactions. You may also find oxidation products, particularly on methionine or cysteine residues, and residual solvents or TFA salts from the cleavage process. These impurities can trigger non-specific immune responses or interfere with enzyme assays, which is why research grade peptide purity standards require rigorous analytical validation.
Why is batch-level traceability critical for research-grade compounds?
Batch-level traceability ensures that every vial you receive comes from a single, documented synthesis run with its own Certificate of Analysis. This matters because batch-to-batch consistency metrics can vary between synthesis runs, even from the same supplier. If your results change unexpectedly, traceability lets you confirm whether a purity variance or impurity profile shift in a specific batch caused the issue. It also supports reproducibility requirements for peer-reviewed publications and regulatory audits.