Impact of Peptide Purity on Assays: HPLC & QC Guide
Table of Contents
- Why Peptide Purity Decides Whether Your Assay Data Holds Up
- How Peptide Synthesis Impurities Enter Your Samples
- HPLC Peptide Analysis: Reading the Chromatogram Before You Trust the Vial
- Impurity Effects on Mass Detection, Signal-to-Noise, and Ion Suppression
- Assay Reproducibility Challenges Tied to Batch-to-Batch Variance
- System Suitability, Calibration, and QC Metrics That Catch Drift Early
- Troubleshooting MS Artifacts and What Regulators Expect From Peptide QC
- Frequently Asked Questions
Last Updated: September 15, 2026
Why Peptide Purity Decides Whether Your Assay Data Holds Up
Peptide purity is the percentage of the target peptide sequence present relative to all other material in a sample, and it is the single most underrated variable in assay design. When purity drifts, every downstream measurement inherits that error. This guide from FROPeptides breaks down how impurities enter your samples, how to read an HPLC chromatogram before you commit a vial to a run, and what regulators expect from peptide QC.
Here is the core tension most labs miss: an assay can be perfectly validated and still produce garbage if the input peptide is only 70% pure. The instrument isn’t lying. The sample is. Understanding the impact of peptide purity on assays means treating purity as a controlled variable, not a footnote on a certificate.
The most common mistake is accepting a vendor’s stated purity percentage at face value. A “98% pure” label means nothing without the chromatogram and mass spectrum behind it. Always request batch-level data before you trust a vial.
How Peptide Synthesis Impurities Enter Your Samples
Peptide synthesis impurities originate in the chemical process itself, not in shipping or handling. Solid-phase peptide synthesis builds a chain one amino acid at a time, and each coupling step can fail, leaving truncated sequences behind.
The main impurity classes you’ll encounter:
- Deletion peptides: sequences missing one or more residues from incomplete coupling
- Truncation products: chains that stopped early during synthesis
- Insertion and substitution byproducts: wrong amino acids incorporated at a position
- Scrambled sequences: racemization that alters stereochemistry
- Counterions and residual solvents: TFA salts and synthesis reagents
A common approach is to run crude material through preparative HPLC purification, but purification efficiency varies. Peptides that aggregate or fold poorly are harder to separate cleanly, which is why some sequences are inherently harder to produce at high purity than others.
Hydrophobic and aggregation-prone sequences are the hardest to purify. If your target peptide falls into that category, budget for a higher-purity grade from the start rather than trying to rescue a low-purity batch downstream.
HPLC Peptide Analysis: Reading the Chromatogram Before You Trust the Vial
HPLC peptide analysis separates sample components by hydrophobicity, and the resulting chromatogram tells you what’s actually in the vial. The main peak is your target peptide. Everything else is impurity.
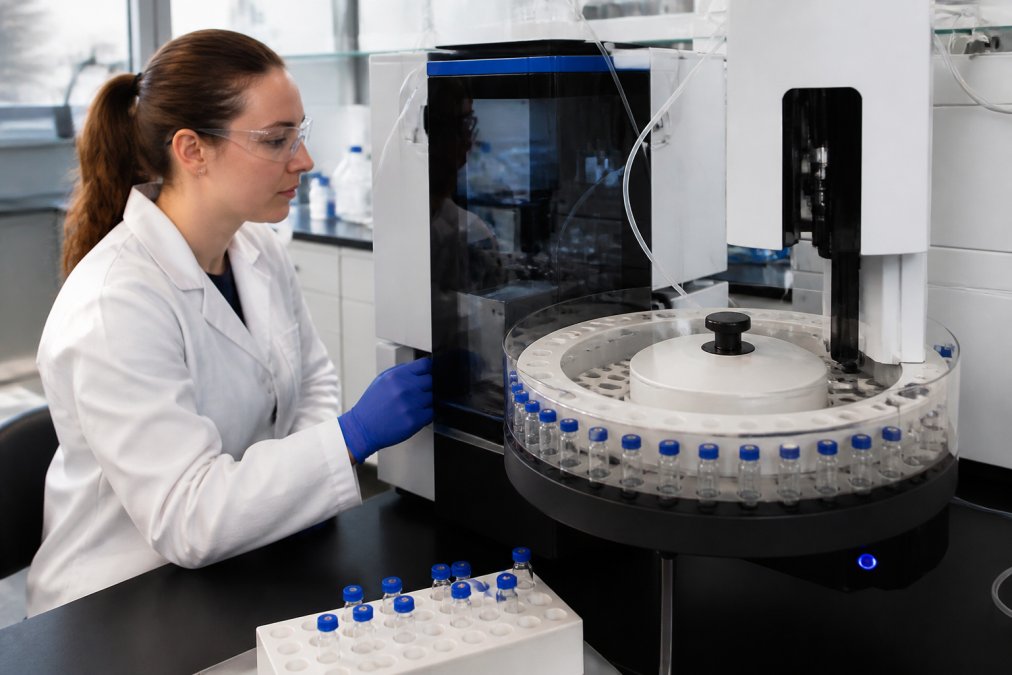
What most guides miss is that peak area percentage is not the same as purity by mass. UV detection at 214 nm responds to the peptide backbone, so a co-eluting impurity with a similar absorbance profile can hide inside your main peak. For rigorous work, you need orthogonal confirmation.
Key chromatogram signals to evaluate:
- Main peak symmetry: tailing or fronting suggests co-elution or column issues
- Baseline noise: elevated baselines can mask small impurity peaks
- Retention time consistency: shifts between runs point to method drift or column degradation
- Impurity peak count: more peaks mean more separation work ahead
For deeper method detail, the USP general chapter on chromatographic separation provides the framework most QC labs build on.
Impurity Effects on Mass Detection, Signal-to-Noise, and Ion Suppression
Ion suppression is the mechanism by which co-eluting impurities reduce your analyte signal in the mass spectrometer, and it is the quiet killer of quantitative assays. When impurities compete for charge during electrospray ionization, your target peptide’s signal drops, sometimes dramatically.
The chain reaction looks like this: impurities co-elute with your analyte, they consume ionization efficiency, the signal-to-noise ratio falls, and your limit of detection rises. A method that looked sensitive on a clean standard can fail on a real sample.
Practical implications for your workflow:
- Signal-to-noise ratio should be monitored on every batch, not just at validation
- Mass accuracy degrades when impurity ions crowd the spectrum
- Quantitative analysis inherits error directly from impurity-driven suppression
Purity and analytical sensitivity are linked. A 5% impurity load can translate into a disproportionate loss of signal-to-noise, which is why high-purity input material is cheaper than re-validating a failing method.
Assay Reproducibility Challenges Tied to Batch-to-Batch Variance
Assay reproducibility challenges almost always trace back to batch-to-batch variance in the input peptide. Two vials labeled with the same purity grade can behave differently if their impurity profiles differ. This is the part that catches experienced labs off guard: you validate a method on batch A, it performs beautifully, and then batch B produces shifted results. The method didn’t change. The material did.
Why “same purity grade” is not the same material
Purity is a single number summarizing a complex mixture. Two lots can both read 95% by HPLC area percent and still differ in:
- Identity of the impurity population. One lot may be mostly truncated sequences; another may be mostly deletion peptides. Truncations and deletions ionize differently and co-elute differently, so their impact on your assay is not interchangeable.
- Counterion content. Residual trifluoroacetate (TFA) from purification can vary substantially between lots. TFA is UV-transparent at 214 nm but suppresses electrospray ionization, so a lot with more residual TFA can show lower signal even at identical peptide purity.
- Water and salt content. A lot that has absorbed atmospheric moisture weighs differently than a dry lot, so a mass-based preparation delivers a different molar amount than intended.
- Aggregation state. Hydrophobic sequences can self-associate to varying degrees, changing effective concentration and chromatographic behavior.
How variance shows up in your data
Variance is rarely random. It clusters in predictable places:
- Standard curve slope shifts between batches, often the first sign that the input material changed.
- Retention time drift on the same method, same column, same day.
- Inconsistent recovery in spiked samples, especially at low concentrations where ion suppression dominates.
- Replicate failures that do not correlate with instrument state.
If your standard curve slope moves by more than a few percent between lots prepared the same way, stop and compare the CoAs before you touch the method. The method is usually innocent.
A batch-traceability workflow that actually controls variance
- Qualify each lot on receipt. Run the vendor’s CoA data against your own in-house HPLC and MS confirmation. Do not accept the CoA as the only evidence.
- Assign a lot-specific correction factor where quantitative work demands it. If you know the counterion and water content, you can correct the weighed mass to true peptide content.
- Bridge lots with a side-by-side comparison. Before switching production to a new lot, run both lots on the same method and compare slope, retention time, and recovery. A bridging study is cheaper than a failed batch.
- Retain a reference standard from a well-characterized lot and re-qualify it periodically against fresh material.
- Log every lot change against assay results so that when drift appears, you can correlate it with the material rather than guessing.
The cost of getting this wrong
The downstream cost of batch variance is not just the failed run.
System Suitability, Calibration, and QC Metrics That Catch Drift Early
Core metrics to track:
| QC Metric | What It Detects | Action Threshold |
|---|---|---|
| Retention time repeatability | Column degradation, method drift | Investigate any shift beyond method spec |
| Resolution between peaks | Loss of separation | Re-evaluate gradient if resolution drops |
| Signal-to-noise ratio | Sensitivity loss, ion suppression | Flag any downward trend across runs |
| Mass accuracy | Calibration drift | Recalibrate when outside tolerance |
| Peak area precision | Injection or detector issues | Check autosampler and flow path |
Track system suitability metrics in a running log, not just pass/fail per run. A slow downward trend in signal-to-noise over 20 runs tells you more than any single result.
Troubleshooting MS Artifacts and What Regulators Expect From Peptide QC
The artifact classes you will actually see
A practical troubleshooting sequence
Keep a running log of the m/z values you see in your blanks. Within a few weeks you will have a fingerprint of your own system’s background, and artifact identification becomes almost instant.
What regulators actually expect
Matching the platform to the question
Frequently Asked Questions
How does peptide purity affect the signal-to-noise ratio in assays?
Impurities consume detector response and add background noise at the same time. A sample at 95% purity carries roughly 5% foreign material that can co-elute with your analyte, raising baseline noise and suppressing the target signal. The result is a lower signal-to-noise ratio, which pushes your limit of detection higher and makes borderline results harder to call. Running HPLC peptide analysis first tells you whether the noise is coming from the sample or the instrument.
Is 98% purity good enough for sensitive assays?
It depends on the assay. For ELISA work or general screening, 98% HPLC purity is often acceptable. For quantitative LC-MS/MS, receptor binding, or anything measuring post-translational modifications, that remaining 2% can include truncated sequences, deletion peptides, and oxidation products that compete with your target. For those applications, look for 98% or higher by HPLC plus mass spectrometry confirmation of the expected molecular weight.
What are the most common contaminants found in synthetic peptides?
The usual list includes deletion and truncation peptides from incomplete coupling, oxidation products such as methionine sulfoxide, residual trifluoroacetic acid and scavengers from cleavage, and counterion salts from the purification step. Each one behaves differently in an assay. Deletion peptides can act as competitive inhibitors, while residual TFA shifts pH in reconstituted stock solutions and can interfere with ion suppression in electrospray ionization.
Why is batch-to-batch consistency critical for peptide-based assays?
Assay reproducibility challenges usually trace back to a new lot, not a new protocol. If two batches differ by even a few percent in impurity profile, your standard curve shifts and historical data stops being comparable. That is why system suitability checks and instrument calibration should be paired with batch-level Certificates of Analysis. FROPeptides verifies every lot through multi-stage HPLC testing and mass spectrometry, and documents it in the CoA.
Peptide purity is not a checkbox on a supplier’s website; it is the foundation your entire assay rests on. FROPeptides delivers lab-verified research peptides with multi-stage HPLC testing, mass spectrometry verification for every batch, and Certificate of Analysis documentation that lets your lab audit the data before you run a single sample. Get started with FROPeptides and build your next assay on material you can actually verify.