Coenzyme Q10 vs NAD+ for Metabolic Studies: A 2026 Guide
Table of Contents
- Coenzyme Q10 vs NAD+ for Metabolic Studies: What Researchers Need to Know
- CoQ10 and the Mitochondrial Electron Transport Chain
- NAD+ Metabolic Pathways: Redox Balance and Energy Transfer
- Head-to-Head Comparisons: What Metabolic Studies Actually Show
- NAD+ Assay Methods: Measuring Intracellular Levels Accurately
- Research-Grade Coenzyme Purity and HPLC Testing: What to Verify
- Choosing Between Coenzyme Q10 and NAD+ for Your Next Study
- Conclusion: Matching the Coenzyme to the Metabolic Question
- Frequently Asked Questions
Last Updated: October 5, 2026
Coenzyme Q10 vs NAD+ for Metabolic Studies: What Researchers Need to Know
The coenzyme q10 vs nad+ distinction matters most when designing a metabolic study and picking the right marker.
The question we hear most is not “which is better” but “which one answers my research question.”
Below, we break down the biochemistry, assay methods, and study-design trade-offs so you can match the coenzyme to the metabolic outcome you are measuring.
CoQ10 and the Mitochondrial Electron Transport Chain
CoQ10, or coenzyme Q10, is a fat-soluble benzoquinone that carries electrons between Complexes I and II and Complex III in the mitochondrial electron transport chain. Without adequate CoQ10, oxidative phosphorylation stalls and ATP production drops.
Complex I and II: Where CoQ10 Accepts Electrons
CoQ10 accepts electrons from both Complex I (NADH dehydrogenase) and Complex II (succinate dehydrogenase). This dual entry point means CoQ10 status affects measurements from either complex, and a single-site assay can miss a deficit that appears under only one substrate.
Why CoQ10 Status Alters ATP Production Measurements
When tissue CoQ10 is depleted, ATP synthesis falls even if the electron transport chain complexes are intact. Treat CoQ10 as a variable, not a constant.
NAD+ Metabolic Pathways: Redox Balance and Energy Transfer
NAD+ is a dinucleotide cofactor that accepts hydride ions during glycolysis and the TCA cycle, becoming NADH, which then feeds electrons into Complex I, linking cytosolic metabolism to mitochondrial ATP production.
Glycolysis, the TCA Cycle, and NADH Shuttling
Because the inner mitochondrial membrane is impermeable to NADH, cells rely on shuttles such as the malate-aspartate and glycerol-3-phosphate systems (pubmed.ncbi.nlm.nih.gov). Measured NAD+/NADH ratios therefore reflect synthesis and transport, not just raw production.
Sirtuins, PARPs, and NAD+ as a Signaling Substrate
NAD+ is also consumed by sirtuins and PARPs, enzymes tied to DNA repair and stress response (pubmed.ncbi.nlm.nih.gov). A falling NAD+ level may signal increased consumption rather than reduced synthesis, a distinction that matters when interpreting metabolic markers.
Head-to-Head Comparisons: What Metabolic Studies Actually Show
The most important thing to understand about this literature is that almost no trial has randomized participants to both a CoQ10 arm and an NAD+ precursor arm under one protocol. The comparison readers want, CoQ10 versus NAD+ in the same study, population, and endpoints, is largely a comparison of two separate evidence streams.
Direct Evidence vs. Indirect Comparison: A Framing Rule
Before citing anything, sort the evidence into three tiers:
- Tier 1, Direct: A single randomized trial with both compounds as separate arms and a shared primary endpoint. This tier is close to empty for CoQ10 vs. NAD+ in metabolic outcomes.
- Tier 2, Indirect, shared endpoint: Separate trials of CoQ10 and of an NAD+ precursor that measured the same outcome (for example, both reported a lipid marker or a mitochondrial respiration metric). These can be compared cautiously, but only if population, dose, duration, and assay method are reasonably aligned.
- Tier 3, Mechanistic inference: Reasoning from pathway biology that because CoQ10 feeds the electron transport chain and NAD+ feeds Complex I, they should produce additive effects. This is a hypothesis, not a finding.
Most consumer-facing pages blur all three tiers together. A study-centered review should label each claim with its tier.
What the CoQ10 Trial Literature Actually Measures
CoQ10 trials in metabolic and cardiovascular contexts have most often used oral ubiquinone or ubiquinol at roughly 100-300 mg per day, over weeks to months. Recurring endpoints are:
- Lipid and lipoprotein markers, including LDL oxidizability, because CoQ10 circulates bound to lipoproteins.
- Inflammatory and oxidative-stress markers, such as measures of lipid peroxidation.
- Exercise or functional capacity endpoints, including VO2 peak and work efficiency, though these have produced inconsistent results across trials.
A recurring pattern: CoQ10 supplementation reliably raises circulating CoQ10, while downstream clinical or functional endpoints move inconsistently. That gap between biomarker and outcome response is itself worth discussing in a study design.
What the NAD+ Precursor Trial Literature Actually Measures
Nicotinamide riboside (NR) and nicotinamide mononucleotide (NMN) have the most human data. Trials have generally used NR at roughly 250-1,000 mg per day, and NMN at similar or somewhat lower ranges, over weeks to months.
The endpoints in this literature skew toward:
- Blood or tissue NAD+ levels, which is the most consistently reported outcome.
- Insulin sensitivity and glucose handling markers.
- Lipid markers and body-composition measures, reported inconsistently.
The honest summary: NAD+ precursors reliably raise measured NAD+ in many (not all) trials, while clinical metabolic endpoints are mixed and often null in already-healthy, well-nourished participants.
Interpreting Null and Mixed Results in Crossover Trials
Randomized crossover designs are attractive because they control for between-person variation in baseline CoQ10 status and NAD+ levels, both of which vary widely. But they introduce their own failure modes:
- Washout adequacy. CoQ10 has a long tissue half-life, so a washout that is fine for a water-soluble precursor may be too short for CoQ10, carrying treatment effects into the control period.
- Baseline status as an effect modifier. If participants enter the trial already replete, there is little room for a supplement to move the marker. A null result in a replete population says nothing about a deficient one.
- Endpoint sensitivity. Self-reported energy or fatigue scales are far less sensitive than a measured NAD+/NADH ratio or a lipid peroxidation assay, and null results on soft endpoints are frequently over-interpreted.
A Practical Appraisal Checklist
When reading any CoQ10 or NAD+ metabolic trial, record these before the conclusion:
- Design: parallel or crossover, and if crossover, washout length relative to the compound’s half-life.
- Sample size and power: small trials in this space are common, and underpowered nulls are not evidence of no effect.
- Population baseline status: replete vs. deficient, healthy vs. metabolically compromised.
- Dose, form, and formulation: ubiquinone vs. ubiquinol; NR vs. NMN; whether the formulation was lipid-solubilized.
- Primary vs. secondary endpoints: whether the headline claim came from a prespecified primary outcome or a secondary, exploratory one.
- Assay method: how NAD+ or CoQ10 was measured, and whether the method was validated for the matrix used.
There is no large, well-powered head-to-head randomized trial pitting CoQ10 against an NAD+ precursor on shared metabolic endpoints. Any page that presents the two as directly compared is almost certainly making an indirect or mechanistic argument. Say so explicitly, that transparency is the differentiator.
| Factor | CoQ10 | NAD+ |
|---|---|---|
| Solubility | Lipid-soluble | Water-soluble |
| Primary role | Electron carrier (ETC) | Redox cofactor, signaling substrate |
| Key outcome markers | ATP production, LDL oxidation | NAD+/NADH ratio, sirtuin activity |
| Common precursor | Ubiquinol, ubiquinone | Nicotinamide riboside (NR), NMN |
| Best for studying | Mitochondrial energy, lipid profile | Redox balance, cellular signaling |
| Typical trial dose range | ~100-300 mg/day (ubiquinone/ubiquinol) | ~250-1,000 mg/day (NR); similar range for NMN |
| Direct head-to-head human data | Essentially absent | Essentially absent |
NAD+ Assay Methods: Measuring Intracellular Levels Accurately
NAD+ measurement is where many otherwise well-designed metabolic studies quietly go wrong. The analyte is labile, related nucleotides interfere with each other, and method choice determines whether you can distinguish NAD+ from NADH at all. This section covers method families, trade-offs, and the sample-handling decisions that determine whether your numbers are interpretable.
The Two Main Method Families
Enzymatic cycling assays use alcohol dehydrogenase or a similar NAD+-dependent enzyme in a cycling reaction that amplifies signal. They are inexpensive, plate-reader friendly, and sensitive enough for many tissue and blood matrices.
A third option, fluorescence-based NAD(H) detection, suits live-cell or plate-based work but is the most interference-prone and best treated as a screening tool, not a quantitative endpoint method.
Matching the Method to the Study Design
| Study need | Better fit | Why |
|---|---|---|
| Large sample batches, total NAD(H) | Enzymatic cycling | Low cost per sample, plate-scale throughput |
| NAD+/NADH ratio as primary endpoint | LC-MS/MS | Separates the two species chromatographically |
| Live-cell or kinetic measurement | Fluorescence or genetically encoded sensors | Real-time readout, but lower quantitative precision |
| Multi-analyte nucleotide panel | LC-MS/MS | Quantifies NAD+, NADH, NADP+, NMN, NR in one run |
Sample Handling Pitfalls That Skew NAD+ Readings
NAD+ degrades quickly, both enzymatically and chemically. The practical rules that matter most:
- Quench fast. Delaying quenching after tissue harvest or blood draw drives readings down before the assay starts. Snap-freeze tissue in liquid nitrogen and process on dry ice.
- Control pH. NAD+ is unstable under alkaline conditions; acidic extraction is standard for preserving it, and the extraction buffer choice should match your detection method.
- Inhibit NAD+-consuming enzymes. CD38, PARPs, and sirtuins continue consuming NAD+ in a crude lysate. Including an appropriate inhibitor in the extraction buffer prevents post-harvest loss that looks like in vivo depletion.
Skipping a quenching step or leaving samples at room temperature for even a few minutes can drop measured NAD+ levels substantially, producing false “depletion” results that have nothing to do with the biology you are studying. The same applies to omitting a CD38 or PARP inhibitor from the extraction buffer, the enzyme activity continues in the tube.
Reporting Standards That Make Results Comparable
Because method choice changes absolute values, a study is interpretable only if it reports the assay platform and vendor, extraction buffer and inhibitors, whether NAD+ and NADH were measured separately, the normalization basis (protein, tissue weight, or cell count), and spike-recovery efficiency. Without those, a reported NAD+/NADH ratio cannot be compared across labs, a major reason the NAD+ literature looks more inconsistent than it may be.
If your primary endpoint is the NAD+/NADH ratio, validate your extraction and quenching protocol against a spike-recovery standard before you run the study, not after. A one-day validation run prevents a months-long dataset from being uninterpretable.
Research-Grade Coenzyme Purity and HPLC Testing: What to Verify
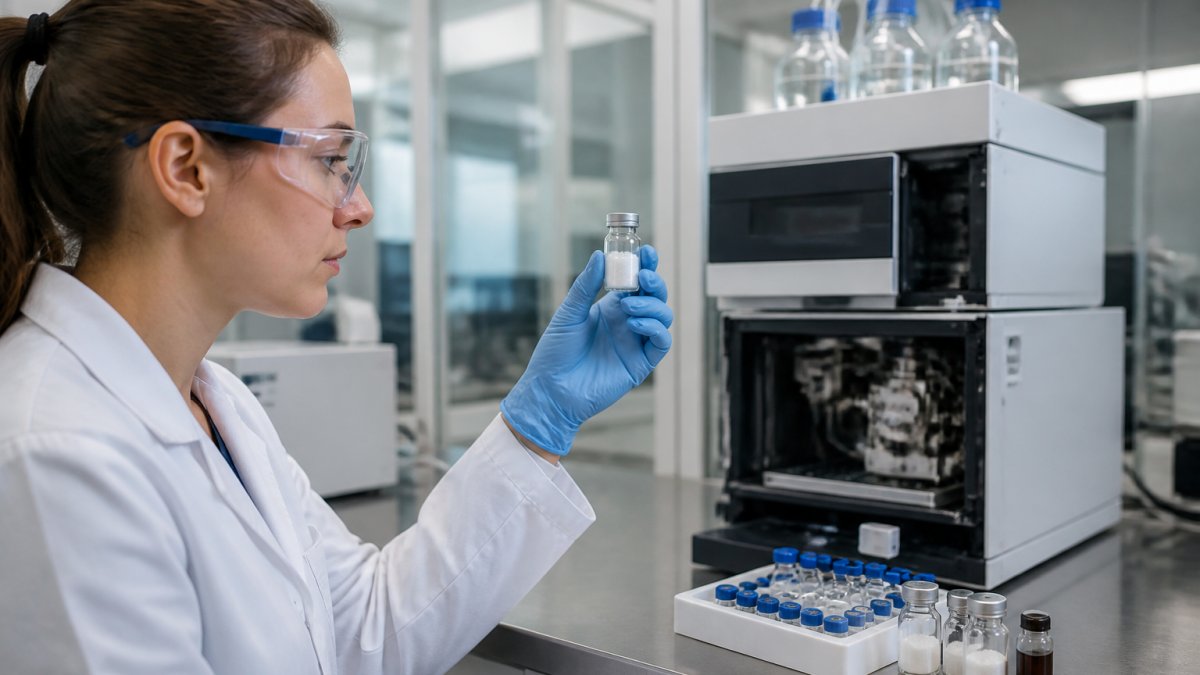
Research-grade coenzyme purity and HPLC testing determine whether your starting material matches the label. Impurities or degraded batches introduce variance no statistical model can fix.
Bioavailability, Formulation, and Dose Considerations
CoQ10 bioavailability depends heavily on formulation: ubiquinol and solubilized ubiquinone absorb differently, and dose-response is not linear. NAD+ precursors vary in how efficiently they raise intracellular NAD+, with NR and NMN studied most often.
Safety, Interactions, and Population-Specific Factors
Both compounds are generally well tolerated in research settings, but CoQ10 can interact with anticoagulants, and NAD+ precursor effects may differ in older or metabolically compromised populations. Population-specific factors should shape dose and endpoint selection.
When sourcing research-grade coenzymes, request the Certificate of Analysis (CoA) for the exact lot, not just the product line. Batch-level traceability is what lets you defend your results if a reviewer questions starting-material consistency.
Choosing Between Coenzyme Q10 and NAD+ for Your Next Study
The right choice comes down to your endpoint. For mitochondrial ATP production, electron transport chain efficiency, or lipid oxidation, CoQ10 is the more direct marker.
For labs that need consistent, batch-traceable material, FROPeptides supplies lyophilized coenzymes backed by multi-stage HPLC testing and mass spectrometry verification, with a CoA for every order.
Conclusion: Matching the Coenzyme to the Metabolic Question
The coenzyme q10 vs nad+ decision is not about superiority; it is about which compound answers your specific metabolic question. CoQ10 reveals electron transport and lipid oxidation; NAD+ reveals redox balance and cellular signaling.
When your protocol demands verified purity and batch-level traceability, FROPeptides delivers research-grade lyophilized coenzymes with multi-stage HPLC testing, mass spectrometry verification, and a Certificate of Analysis for every lot.
Frequently Asked Questions
Is NAD+ better than CoQ10 for metabolic research?
Neither is universally better; the choice depends on the metabolic question. CoQ10 studies typically focus on mitochondrial electron transport chain function, ATP production, and LDL oxidation, while NAD+ research centers on redox balance, sirtuin activity, and NAD+ precursor supplementation such as nicotinamide riboside. Randomized crossover trials of CoQ10 have measured VO2 peak and total work efficiency, while NAD+ trials often track NAD+ levels and metabolic markers. Match the coenzyme to your specific molecular markers and study design.
Can CoQ10 and NAD+ be used together in a metabolic study?
Yes, and several study designs do combine them because their roles in cellular energy metabolism are complementary. CoQ10 operates in the mitochondrial electron transport chain, while NAD+ functions as a coenzyme in glycolysis, the TCA cycle, and oxidative phosphorylation. A combined protocol can assess mitochondrial function and redox balance simultaneously. When designing such a study, verify that your assay methods can distinguish CoQ10 and NAD+ contributions and that your research-grade materials meet purity specifications.
What purity and analytical testing should researchers look for when sourcing CoQ10 or NAD+?
Look for multi-stage HPLC testing and mass spectrometry verification on every batch, plus a Certificate of Analysis that includes purity percentage and identification confirmation. For CoQ10, HPLC with UV detection at 275 nm is standard; for NAD+, LC-MS methods provide the sensitivity needed to detect degradation products. Request batch-level documentation before committing, and confirm that suppliers use temperature-controlled storage and shipping, since both compounds are sensitive to heat and light.
Why do some clinical trials show null results for CoQ10 or NAD+ supplementation?
Null outcomes often trace to study design factors rather than the compound itself: insufficient dose, poor bioavailability of the formulation, short trial duration, or baseline levels that were already adequate in participants. Crossover trials can also carry carryover effects if washout periods are too short. When a trial reports no significant change in VO2 peak or metabolic markers, check whether the dose, formulation, and population were appropriate before concluding the coenzyme is ineffective.