Pure Peptides: Purity vs Net Content Explained (2026)
Table of Contents
- Pure Peptides: What Purity Percentages Actually Measure
- HPLC Peptide Analysis: Reading the Chromatogram Behind the Claim
- Mass Spectrometry Peptide Verification: Confirming the Amino Acid Sequence
- Research Peptide Quality Assurance: Batch Traceability and CoA Documentation
- Synthesis Byproducts and Counterions: The Impurities Purity Scores Miss
- Storage, Reconstitution, and Degradation: Protecting Pure Peptides After Delivery
- Matching Purity Thresholds to In Vivo and In Vitro Study Requirements
- Conclusion: Choosing Pure Peptides That Hold Up Under Analytical Scrutiny
- Frequently Asked Questions
Last Updated: September 25, 2026
Pure Peptides: What Purity Percentages Actually Measure
A purity percentage on a vial of pure peptides tells you how much of the lyophilized powder is the target molecule, not how much peptide you actually have. That distinction matters more than most researchers realize, because a label reading “98% pure” can still leave your assay short on active compound once you account for counterions, water content, and residual synthesis reagents.
Purity vs. Net Peptide Content: The Number Most Labels Hide
Net peptide content is the mass of actual peptide in a vial after subtracting counterions, water, and residual solvents. A 10 mg vial at 98% purity might contain only 7-8 mg of usable peptide once trifluoroacetic acid or acetate counterions are accounted for. Most labels report purity and omit net content entirely, which is why reconstitution calculations drift. If your protocol assumes 10 mg and you weigh out based on that figure, every downstream concentration is off by the same margin.
Skipping net content correction is the most common source of inconsistent assay results. A 15-20% mass discrepancy from counterions will shift your molarity calculations enough to invalidate dose-response curves.
Why 95%, 98%, and 99% Are Not Interchangeable
The gap between 95% and 99% is not a rounding difference. At 95% purity, roughly 1 in 20 molecules in the vial is something other than your target sequence. For screening workflows where you are ranking hundreds of compounds, that impurity load may be tolerable. For receptor binding studies or anything headed toward publication, it is not. Higher purity thresholds cost more because they require additional HPLC purification cycles, and each cycle reduces yield.
| Purity Level | Typical Impurity Load | Best Suited For | Watch Out For |
|---|---|---|---|
| 95% | ~5% | Rough screening, pilot runs | Impurity interference in sensitive assays |
| 98% | ~2% | Most in vitro work, method development | Counterion mass still uncorrected |
| 99%+ | <1% | In vivo studies, publication-grade work | Higher cost, lower yield per synthesis |
HPLC Peptide Analysis: Reading the Chromatogram Behind the Claim
HPLC peptide analysis separates the components of a sample by how they partition between a mobile phase and a stationary phase, and the resulting chromatogram is the primary evidence behind any purity claim. Most reversed-phase methods for research peptides run a C18 column with a water/acetonitrile gradient, a trifluoroacetic acid or formic acid ion-pairing agent, and UV detection at 214 nm, the wavelength where the peptide backbone amide bond absorbs.
Retention Time, Peak Shape, and What Truncated Sequences Look Like
Truncated sequences, peptides missing one or more amino acids from the chain, typically elute close to the target peak because their hydrophobicity is similar. They show up as shoulders or as a broadened main peak rather than as a clean separate signal. This is why peak symmetry matters as much as peak area. A chromatogram reporting 98% purity with a visibly asymmetric main peak is telling you something the number is not.
How Integration Settings and Method Choice Move the Number
Purity is not a fixed property of a vial; it is a measurement, and measurements depend on method. Three levers routinely shift a reported purity figure without any change to the actual powder:
- Baseline and integration thresholds. Raising the baseline or setting a minimum peak area excludes small impurity peaks from the total, which raises the reported percentage. A method that ignores peaks below 0.1% area will report a cleaner product than one that counts them.
- Gradient slope and run time. A shallow gradient resolves close-eluting impurities that a fast gradient co-elutes into the main peak. Short runs look cleaner because unresolved impurities hide inside the target peak.
- Detection wavelength. At 214 nm, impurities lacking a peptide backbone (residual solvents, some counterions) are largely invisible. A method that also runs a second wavelength or a refractive index channel sees a different picture.
Mass Spectrometry Peptide Verification: Confirming the Amino Acid Sequence
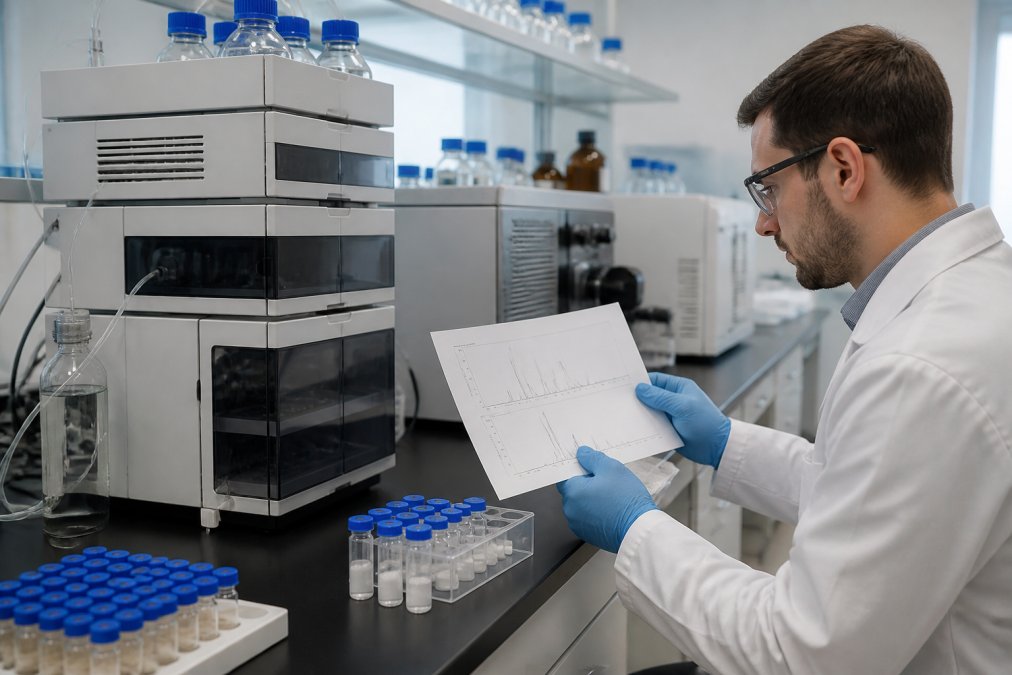
HPLC quantifies; mass spec identifies. A purity percentage without a matching mass confirmation tells you how much of a peak you have, not whether that peak is the right molecule.
Mass Spectrometry Peptide Verification: Confirming the Amino Acid Sequence
Mass spectrometry peptide verification confirms that the molecule in the vial has the correct molecular weight, which is the only way to confirm the amino acid sequence is what the label claims. HPLC tells you how much of something you have. Mass spectrometry tells you what that something is. Run together, they close the loop: a single HPLC peak at the expected retention time plus a mass spec signal at the calculated molecular weight is a defensible identity confirmation.
Research Peptide Quality Assurance: Batch Traceability and CoA Documentation
Research peptide quality assurance depends on documentation you can audit, not on a purity number printed on a label. Batch traceability means you can trace a specific vial back to a specific synthesis run, with the analytical data for that run attached. Without it, you have a claim, not a record.
What a Certificate of Analysis Should Contain (and What It Often Omits)
A complete certificate of analysis includes the batch or lot number, the synthesis date, the analytical method used, the HPLC chromatogram, the mass spectrometry result, the measured purity, and the storage recommendations. What it often omits is net peptide content, the counterion identity, and the actual chromatogram image. A CoA that reports “purity: 98%” with no chromatogram attached asks you to trust a number you cannot inspect.
- Batch or lot number matches the vial label
- HPLC method stated (column, gradient, wavelength)
- HPLC chromatogram image included, not just a percentage
- Mass spectrometry result with calculated molecular weight
- Net peptide content stated
- Counterion identified (trifluoroacetic acid or acetate salt)
- Storage conditions specified
Reading a CoA Critically: The Fields That Change Your Math
Net peptide content. If the CoA states 98% purity but not net content, you cannot convert a weighed mass into a molar concentration without assuming the counterion fraction. A vial labeled 10 mg at 98% purity commonly contains meaningfully less than 10 mg of actual peptide once trifluoroacetic acid or acetate counterions and residual water are subtracted. Every downstream concentration inherits that error.
Batch-to-Batch Consistency Is the Real Quality Signal
A single clean CoA proves one batch was clean. It says nothing about whether the next order will match. The more useful question is whether the impurity profile is stable across lots, same retention time, same peak shape, same mass confirmation, similar net content. When the profile drifts, your assay baseline drifts with it, and results stop being comparable across experiments.
A CoA without a chromatogram image, a stated method, and a net content figure is a summary, not evidence. Ask for the underlying data before you build a protocol around the number.
FDA guidance on analytical method validation for industry
Synthesis Byproducts and Counterions: The Impurities Purity Scores Miss
Counterions are the most underreported component in peptide research. Trifluoroacetic acid and acetate salt are the two common counterions left behind by purification, and they add mass without adding activity. A purity score of 98% by HPLC peak area says nothing about how much of that 98% is peptide versus counterion. This is the gap between purity and content, and it is where reconstitution errors originate.
Storage, Reconstitution, and Degradation: Protecting Pure Peptides After Delivery
Degradation starts the moment a vial leaves controlled storage. Lyophilized peptides are stable at low temperature for extended periods, but once reconstituted, the clock runs fast. Repeated freeze-thaw cycles are the most common cause of premature degradation in working labs, and the damage is usually invisible until an assay fails.
Label every aliquot with the reconstitution date, not just the batch number. Most degradation problems trace back to a vial that was thawed and refrozen more times than anyone tracked.
Matching Purity Thresholds to In Vivo and In Vitro Study Requirements
In vitro studies tolerate lower purity thresholds than in vivo work because the assay system is more forgiving of background signal. Screening workflows at 95% purity are common and defensible when you are ranking compounds rather than characterizing one. Once you move to cell-based assays, 98% becomes the practical floor, because impurity load starts competing with your target for binding sites.
| Study Type | Recommended Purity | Documentation Needed | Rationale |
|---|---|---|---|
| Screening workflows | 95% | Basic CoA | Impurity load tolerable for ranking |
| Cell-based in vitro | 98% | CoA with HPLC and mass spec | Impurities compete for binding sites |
| In vivo studies | 99%+ | Full CoA with net content | Uncontrolled variables in living systems |
Conclusion: Choosing Pure Peptides That Hold Up Under Analytical Scrutiny
The purity number is the beginning of the evaluation, not the end of it. The suppliers worth your budget are the ones that show you the chromatogram, run mass spectrometry on every batch, state net peptide content, and document traceability you can audit. If a supplier will not show you the analytical data behind a claim, the claim is not worth much.
Frequently Asked Questions
What purity should my peptides be for research use?
It depends on the assay. For routine screening workflows, 95% purity is often acceptable. For in vivo studies, clinical trials, or sensitive molecular analysis, 98% or higher is the practical baseline because residual byproducts and truncated sequences can skew results. Always check net peptide content alongside the purity figure, since a 98% pure vial with 70% net content delivers far less active compound than the label implies. Match the threshold to the sensitivity of your experimental accuracy requirements.
Is 95% purity good for peptides?
For many standard laboratory protocols, yes. A 95% HPLC purity result means roughly 5% of the material is something other than the target sequence, which may include truncated sequences, deletion peptides, or counterion residues. That margin is fine for qualitative work but problematic for quantitative assays, dose-response curves, or anything headed toward publication. If your experiment can tolerate 5% variance, 95% works. If not, step up to 98% or 99%.
How can researchers verify the purity of their peptides?
Request the batch-level Certificate of Analysis and read the raw data, not just the summary line. Look for the HPLC chromatogram with retention time and peak area percentages, plus mass spectrometry confirmation of the molecular weight against the expected amino acid sequence. Reputable suppliers provide both for every batch. If a CoA shows only a purity percentage with no chromatogram or mass spec trace, that number is unverifiable.
What is the difference between crude, desalted, and HPLC-purified peptides?
Crude peptides come straight off the synthesis resin with all byproducts intact, often 60-80% purity. Desalted peptides have salts and counterions removed but still contain sequence-related impurities. HPLC-purified peptides have been separated by reversed-phase chromatography to isolate the target sequence, reaching 95% or higher. Most research applications require at least desalted material, and anything quantitative needs HPLC purification with documented analytical validation.
Why does batch-level traceability matter for peptide experiments?
Batch-to-batch consistency determines whether your results replicate. If vial A and vial B from the same supplier differ by 2% in purity or carry different counterions, your assay variance may come from the material, not the biology. Batch-level traceability means every vial links to a specific synthesis lot with its own HPLC and mass spectrometry data. That record lets you troubleshoot failed experiments, document reproducibility for peer review, and reorder material that matches your original conditions.